
Ever looked at a chart and thought, “Wait a second… this looks bullish on the 1-minute chart, but bearish on the 1-hour chart. What’s going on?”

Welcome to the tricky (but extremely powerful) world of technical analysis using multiple timeframes.
If you’ve ever felt confused by conflicting signals, you’re not alone. Traders of all levels fall into this trap. The good news? Once you learn how to read the market across different charts, it feels like you’ve put on X-ray glasses—you suddenly see the bigger picture.
Let’s break it down.
Table of Contents
Why Timeframes Can Make or Break Your Trade
Here’s the deal: markets are fractal. The same patterns, trends, and signals repeat themselves on different scales—whether you’re staring at a 1-minute chart for scalping or a daily chart for swing trading.
The catch? Context changes everything.
A hammer candle on a 5-minute chart doesn’t carry the same weight as a hammer candle on the daily chart. One could be noise, the other a trend reversal.
Weather and climate represent two different things. The current rain (short-term chart) does not change the fact that you reside in a desert (long-term chart). Which one matters more? Both—but in different ways.
Secret #1: Start With the Higher Timeframe
When it comes to multi-timeframe trading strategy, the golden rule is this: start big, then zoom in.
Why? Because the daily chart trend is like the tide, while the 1-hour chart is the waves. And the 1-minute chart? Just ripples. If you’re trying to surf without knowing what the tide is doing, you’re asking for trouble.
👉 Example: Let’s say the daily chart is screaming bullish. You check the 1-hour chart and see a slight pullback. Perfect—that pullback might be your entry for a continuation move.
But if you skipped the higher timeframe check? You might panic and short the pullback… right into the next leg up. Ouch.

Secret #2: Use 3 Timeframes, Not 10
You could open up 20 different charts, but do you really want to feel like you’re juggling knives blindfolded? The best traders keep it simple:
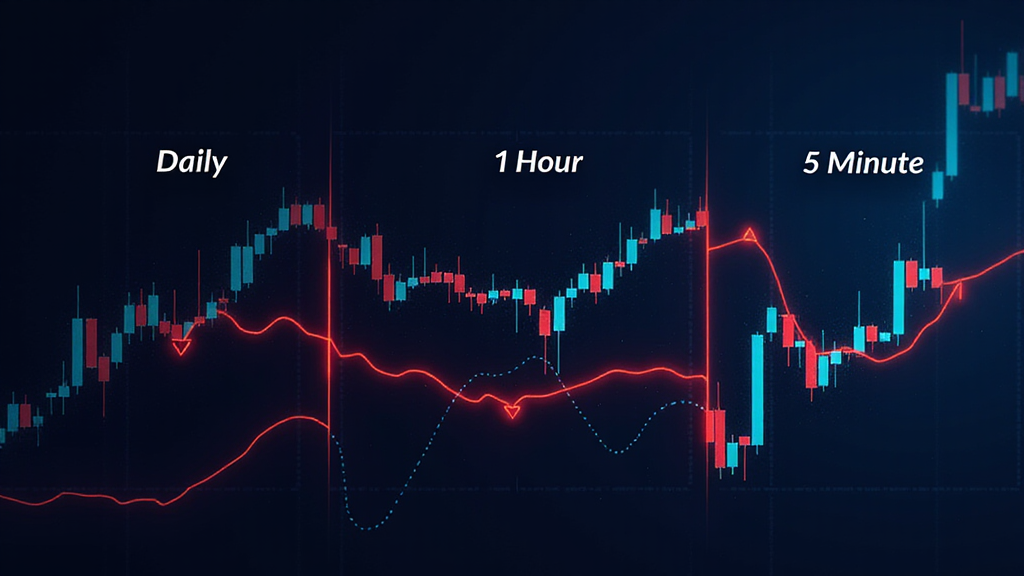
- Daily chart → the overall trend (confirmation)
- 1-hour chart → the setup zone
- 5-minute or 1-minute chart → the precise entry/exit
This structure balances clarity with precision. Too many timeframes? Paralysis. Too few? Tunnel vision.
Secret #3: Confirm Signals Across Charts
Here’s where trading timeframe comparison gets spicy. You want your signals to “stack” across charts.
Example:
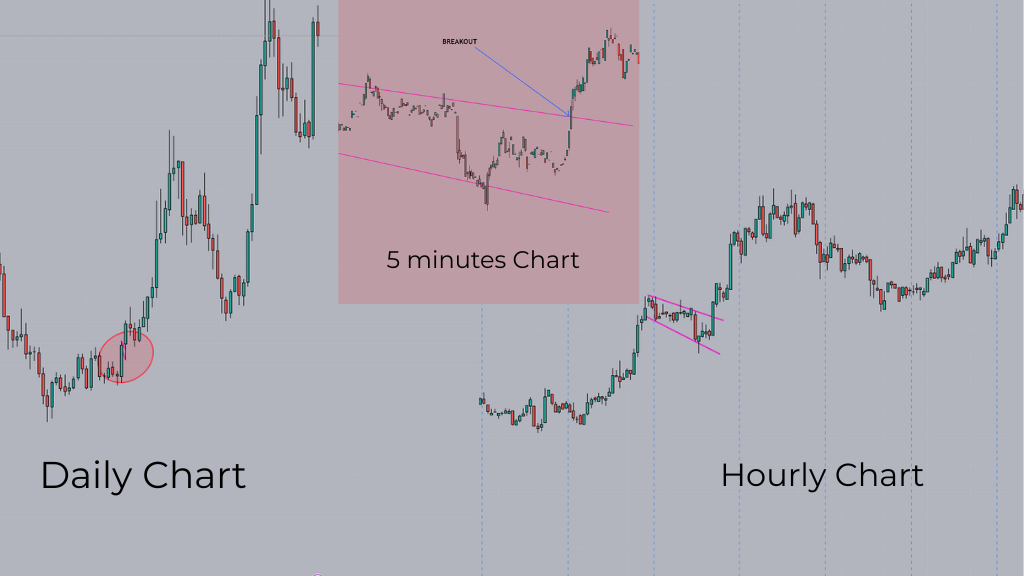
- The daily chart shows a bullish trend.
- The 1-hour chart shows a bullish flag.
- 5-minute chart breaks out with volume.
Everything falling into place creates a feeling of having the wind behind you. Higher timeframe confirmation serves as a beautiful tool that removes market distractions while strengthening your trading self-assurance.
Secret #4: Don’t Marry a Single Timeframe
One of the biggest common mistakes in timeframe selection is getting glued to just one chart. Ever heard of the trader who only stares at the 1-minute chart? Their account usually doesn’t last long.
Short-term charts are noisy. They’re emotional. The world seems to be ending every other candle according to them.
The daily chart view alone might cause you to overlook fantastic intraday trading possibilities. Balance is key.
Secret #5: Match Your Timeframe to Your Personality
This one’s huge. Not everyone is cut out for scalping with the 1-minute chart. It’s intense, fast, and full of adrenaline.
If you’re calmer and more strategic, you might prefer swing Trading with daily chart signals. If you love the middle ground, the 1-hour chart can be your sweet spot.
👉 Trading isn’t just about charts—it’s about psychology. And your trading psychology and timeframes should align. Otherwise, you’ll constantly feel out of sync.

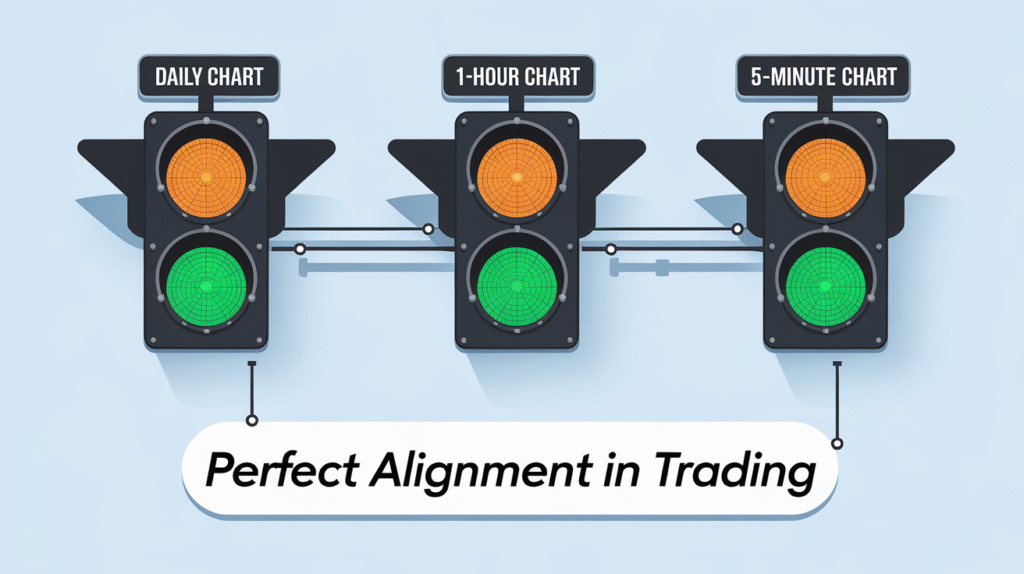
Secret #6: Learn the Art of Timeframe Alignment
Traders call it timeframe alignment in trading. Your chances of success increase dramatically when your short, medium, and long-term charts all show the same direction.
It’s like three green traffic lights in a row. You don’t hesitate—you press the gas.
But if they’re all conflicting? That’s your cue to wait. Sometimes the best trade is no trade.
Secret #7: Context > Signal
This is the most important lesson of all. A pattern without context is just noise. A multi-timeframe analysis for beginners should always teach this: a chart doesn’t exist in isolation.
The daily chart as trend confirmation provides the map. The 1-hour chart for trading setups gives you the route. The 5-minute chart shows you the exact turn.
Ignore the map, and you’ll get lost. Simple as that.
Final Thoughts (aka The Big Picture)
Learning technical analysis through multiple timeframes requires more than memorizing complex indicators or monitoring ten screens at once. It’s about perspective.
Zoom out. Zoom in. Align the signals. Then act with confidence.
Whether you’re a total beginner asking “which timeframe is best for beginners” or a seasoned trader refining your edge, this skill is non-negotiable.
It’s the difference between chasing every ripple… and surfing the wave.

❓ FAQ on Technical Analysis Using Multiple Timeframes
What is the best timeframe for beginners?
For most, the 1-hour chart strikes a balance. It’s not as chaotic as the 1-minute chart, but not as slow as the daily chart. Combine it with higher timeframe confirmation for the best results.
How many timeframes should I use in trading?
Stick to three: one higher timeframe (trend), one medium (setup), one lower (entry). That’s the foundation of a strong multi-timeframe trading strategy.
Can I use multiple timeframe analysis in forex and stocks?
Absolutely. Multiple timeframe analysis forex is extremely popular, but the concept works across stocks, crypto, futures—you name it.
Why do signals look different on each chart?
Because of scale. A bullish pattern on the daily chart might just look like a tiny bounce on the 5-minute chart. That’s why trading signals on different timeframes require context.
What’s the biggest mistake traders make with timeframes?
They either ignore the higher timeframe or get lost in the weeds with short-term noise. The key is higher timeframe confirmation paired with smart entries.


