Let’s be real. The first time you open a trading platform and stare at all those green and red candles… it looks like a Christmas tree gone wrong. Some are tall, some are short, some have long “tails” sticking out, and others are just little blocks. What’s going on here?

That’s precisely why understanding candlestick charts is a must for every trader. Whether you’re into stocks, crypto, or forex, these little candles tell you a story about price action — who’s winning the tug-of-war between buyers and sellers.
Today, I’ll walk you through the basics of how to read candlesticks (open, high, low, close), plus how to tell the difference between a bullish candle and a bearish candle at a glance. No jargon. No fluff. Just the simple stuff you actually need.
Table of Contents
Why bother understanding candlestick charts?
Here’s the thing. Every trader (yes, even the big dogs on Wall Street) uses charts. And most of those charts? They’re candlestick charts.
Why? Because they’re packed with information in a tiny little rectangle. In just one candle, you can see the open, high, low, and close candlestick levels — that’s basically the DNA of price movement.
Think of it like this:
- The open tells you where the fight started.
- The close shows you where it ended.
- The high and low? Those are the battle scars — the extremes where price wandered during the fight.
When you stack hundreds of these candles together, you don’t just see numbers anymore. You see patterns. Momentum. Emotional swings. And if you squint just right, you start to see opportunities.
Step 1: The anatomy of a candlestick (don’t skip this!)
Let’s break down what you’re actually looking at when you open a chart.
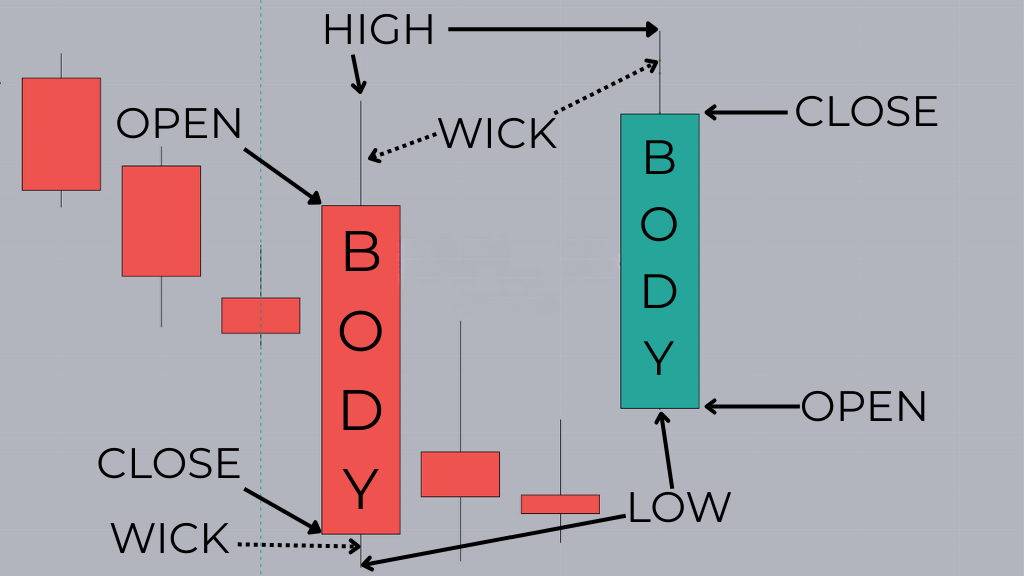
A single candle has two main parts:
- The body – the fat rectangle in the middle.
- The wick (or shadow) – the thin lines sticking out of the top and bottom.
Now here’s the trick:
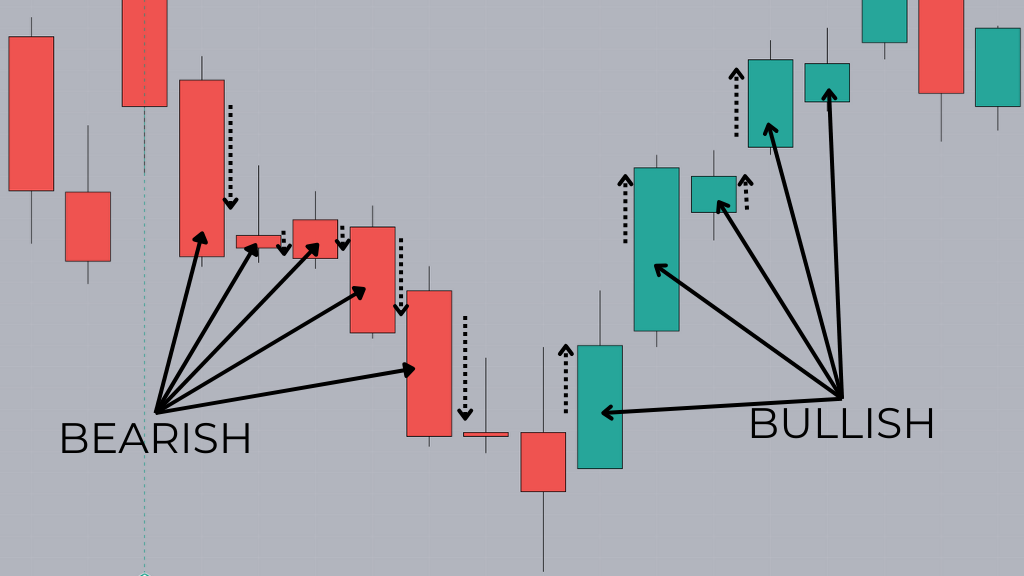
- If the candle is green (or white, depending on your platform), that’s a bullish candle. It means the price closed higher than it opened. Buyers had the upper hand.
- If the candle is red (or black), that’s a bearish candle. Price closed lower than it opened. Sellers were in control.
The candlestick body and wick explained in plain English:
- The top of the body = closing price (if bullish) or opening price (if bearish).
- The bottom of the body = opening price (if bullish) or closing price (if bearish).
- The wick high = the highest price traded during that time.
- The wick low = the lowest price traded.
Boom. You’ve just decoded a candle.
Step 2: Bullish vs. bearish candles — the quick read
Alright, let’s keep it simple.
- A bullish candle means → buyers are pushing the price up.
- A bearish candle means → sellers are dragging the price down.
Imagine you’re watching crypto at midnight. Bitcoin opens at $40,000. By 1 a.m., it closes at $40,500. That’s a green candle, a bullish sign. Buyers were hungry.
Now flip it. It opens at $40,000 but closes at $39,500. That’s a red candle, a bearish sign. Sellers crushed it.
When you see several green candles in a row, buyers are in control. A string of red ones? Sellers are running the show.
This is why green vs red candlestick reading is the foundation of chart trading.
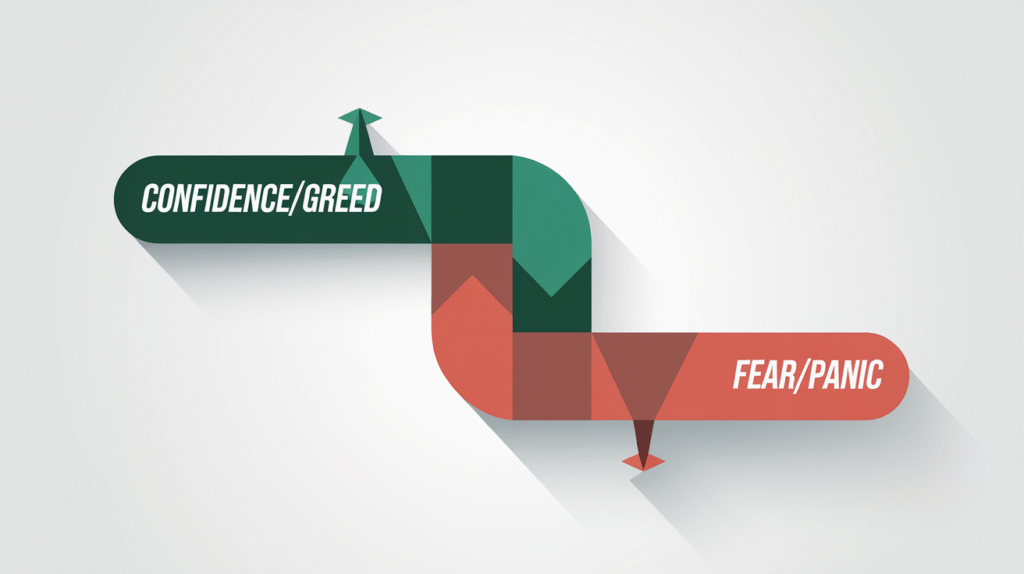
Step 3: What the candles whisper about psychology
Here’s where it gets juicy. Candlesticks aren’t just numbers. They’re emotions on display. Fear, greed, hesitation, confidence — all baked into the chart.
- A long green candle? Buyers went full throttle. Confidence was high.
- A long red candle? Panic selling. Nobody wanted to hold.
- A tiny candle with long wicks? Confusion. Buyers and sellers fought, but neither side won.
This is what traders call trading psychology candlesticks. You’re not just reading prices — you’re reading the crowd’s emotions.
Step 4: Don’t ignore the patterns
While this article is about basics, you’ll quickly hear about single candlestick patterns like the hammer, doji, or engulfing. These are just special candles that signal something unique.
- A hammer (tiny body, long lower wick) might hint that buyers are stepping in after sellers pushed too far.
- A doji (almost no body, long wicks) screams indecision.
- An engulfing candle (a candle that covers the previous candle) often signals a reversal.
That’s where candlestick interpretation becomes a skill. You’re not memorizing flashcards — you’re learning to read a language.
Step 5: Where people mess up with candlestick trading for beginners
Okay, quick warning. A lot of newbies mess this up.
Here are the biggest mistakes I see:
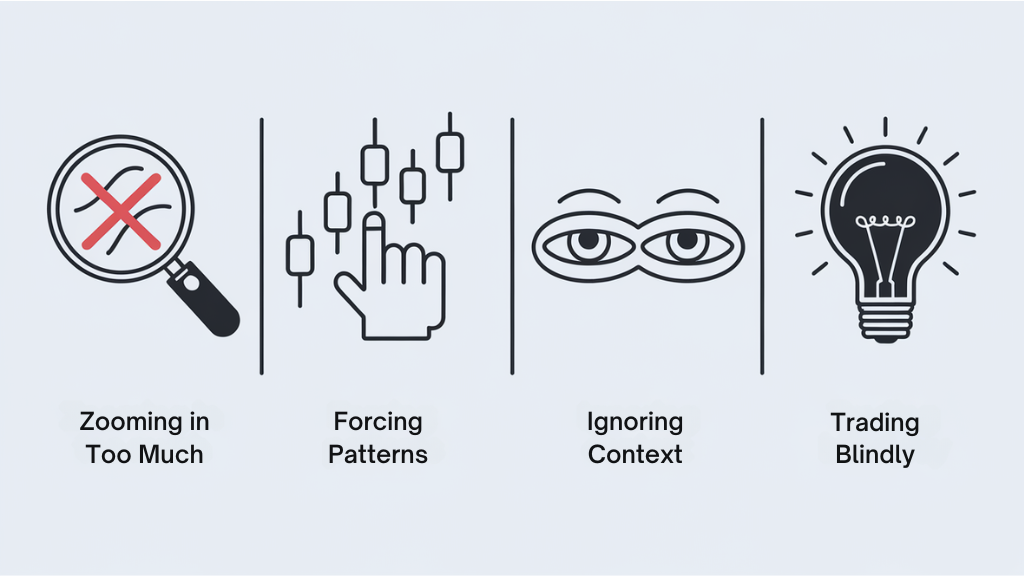
- Zooming in too much. Watching 1-minute candles and freaking out at every little move. Relax. Look at bigger timeframes too.
- Forcing patterns. Not every candle is a signal. Sometimes a candle is just… a candle.
- Ignoring context. A bullish candle in a strong downtrend? Be careful. That might just be a blip, not a trend reversal.
- Trading blindly. Candles give clues, but combine them with other tools like support and resistance, volume, or trend lines.
All these are what I call candlestick chart mistakes to avoid — and trust me, avoiding them will save you a ton of frustration.
Step 6: Use candles across markets
Here’s the best part: once you nail this skill, you can use it everywhere.
- Stocks? Same rules apply.
- Forex? Candles work like a charm.
- Crypto? Honestly, they’re even more important here because the market runs 24/7 and emotions go wild.
So whether you’re looking at a crypto candlestick chart guide or analyzing Apple stock, the basics don’t change.
Step 7: Your first simple candlestick trading strategy
I promised no fluff, so let me give you a dead-simple way to practice.
- Open a chart (crypto, forex, stocks, it doesn’t matter).
- Switch it to candlestick view.
- Look for three green candles in a row. That’s bullish momentum.
- Look for three red candles in a row. That’s bearish momentum.
Don’t trade it yet — just practice price action candlestick observation. Take notes. Write down what you see and how the price reacts after.
Do this for a week, and you’ll be shocked at how much more confident you feel.
Quick recap (so you don’t forget)
- Understanding candlestick charts = learning to read price emotions.
- Each candle represents open, high, low, and close candlestick snapshot.
- Green candles indicate a bullish candle, which means buyers are winning.
- Red candles indicate a bearish candle, which means sellers are winning.
- Wicks = the extremes. Bodies = the core move.
- Patterns and psychology matter, but don’t overcomplicate it at first.
The truth? Trading is like learning a language. At first, you stumble through the alphabet (candles). Then, you start reading short words (patterns). Eventually, you can read full stories (market structure).
And it all starts here — by truly understanding candlestick charts.
Final thoughts
Candlesticks are the heartbeat of the market. They pulse with fear and greed, wins and losses, chaos and order. Once you learn to read them, you’ll never look at a chart the same way again.
- So next time you open your platform and see those green and red rectangles staring back at you? Smile. Because now, you know what they’re trying to say.
❓ FAQ on Understanding Candlestick Charts
Q1: What does understanding candlestick charts actually mean?
It means learning how to read the open, high, low, and close candlestick structure. Once you get it, you can quickly see if buyers (bullish candle) or sellers (bearish candle) are in control.
Q2: How can I tell the difference between a bullish and a bearish candle?
Simple. A bullish candle is green and closes higher than it opened — buyers win. A bearish candle is red and closes lower than it opened — sellers dominate.
Q3: Why are candlestick charts better than line charts?
Line charts only show closing prices. Candlestick chart basics give you way more detail, including highs, lows, and intraday action. That’s why traders prefer them for price action candlestick strategies.
Q4: Can I use candlestick patterns in crypto trading?
Absolutely. A crypto candlestick chart guide follows the same rules as stocks or forex. The only difference? The continuous operation of Crypto throughout 24 hours leads to more intense and unpredictable emotional responses in candlestick signals.
Q5: What mistakes should beginners avoid when reading candlesticks?
Don’t force patterns, don’t zoom in too much, and don’t ignore context. These are the top candlestick chart mistakes to avoid if you want consistent results.
Q6: Do candlestick charts work for short-term and long-term trading?
Yes! Day traders use them for fast decisions, while swing traders rely on them to spot momentum shifts. That’s why candlestick trading for beginners is the foundation for any strategy.


